2021 Hotel Development Cost Survey | India
Hotelivate is pleased to share the analysis and insights of the 2021 Hotel Development Cost Survey | India. This survey presents the results of an extensive review of actual development costs of nearly 400 hotels, across positioning and locations, that opened in the country between 2002 and 2020, in addition to offering an in-depth understanding of trends and the factors impacting them.
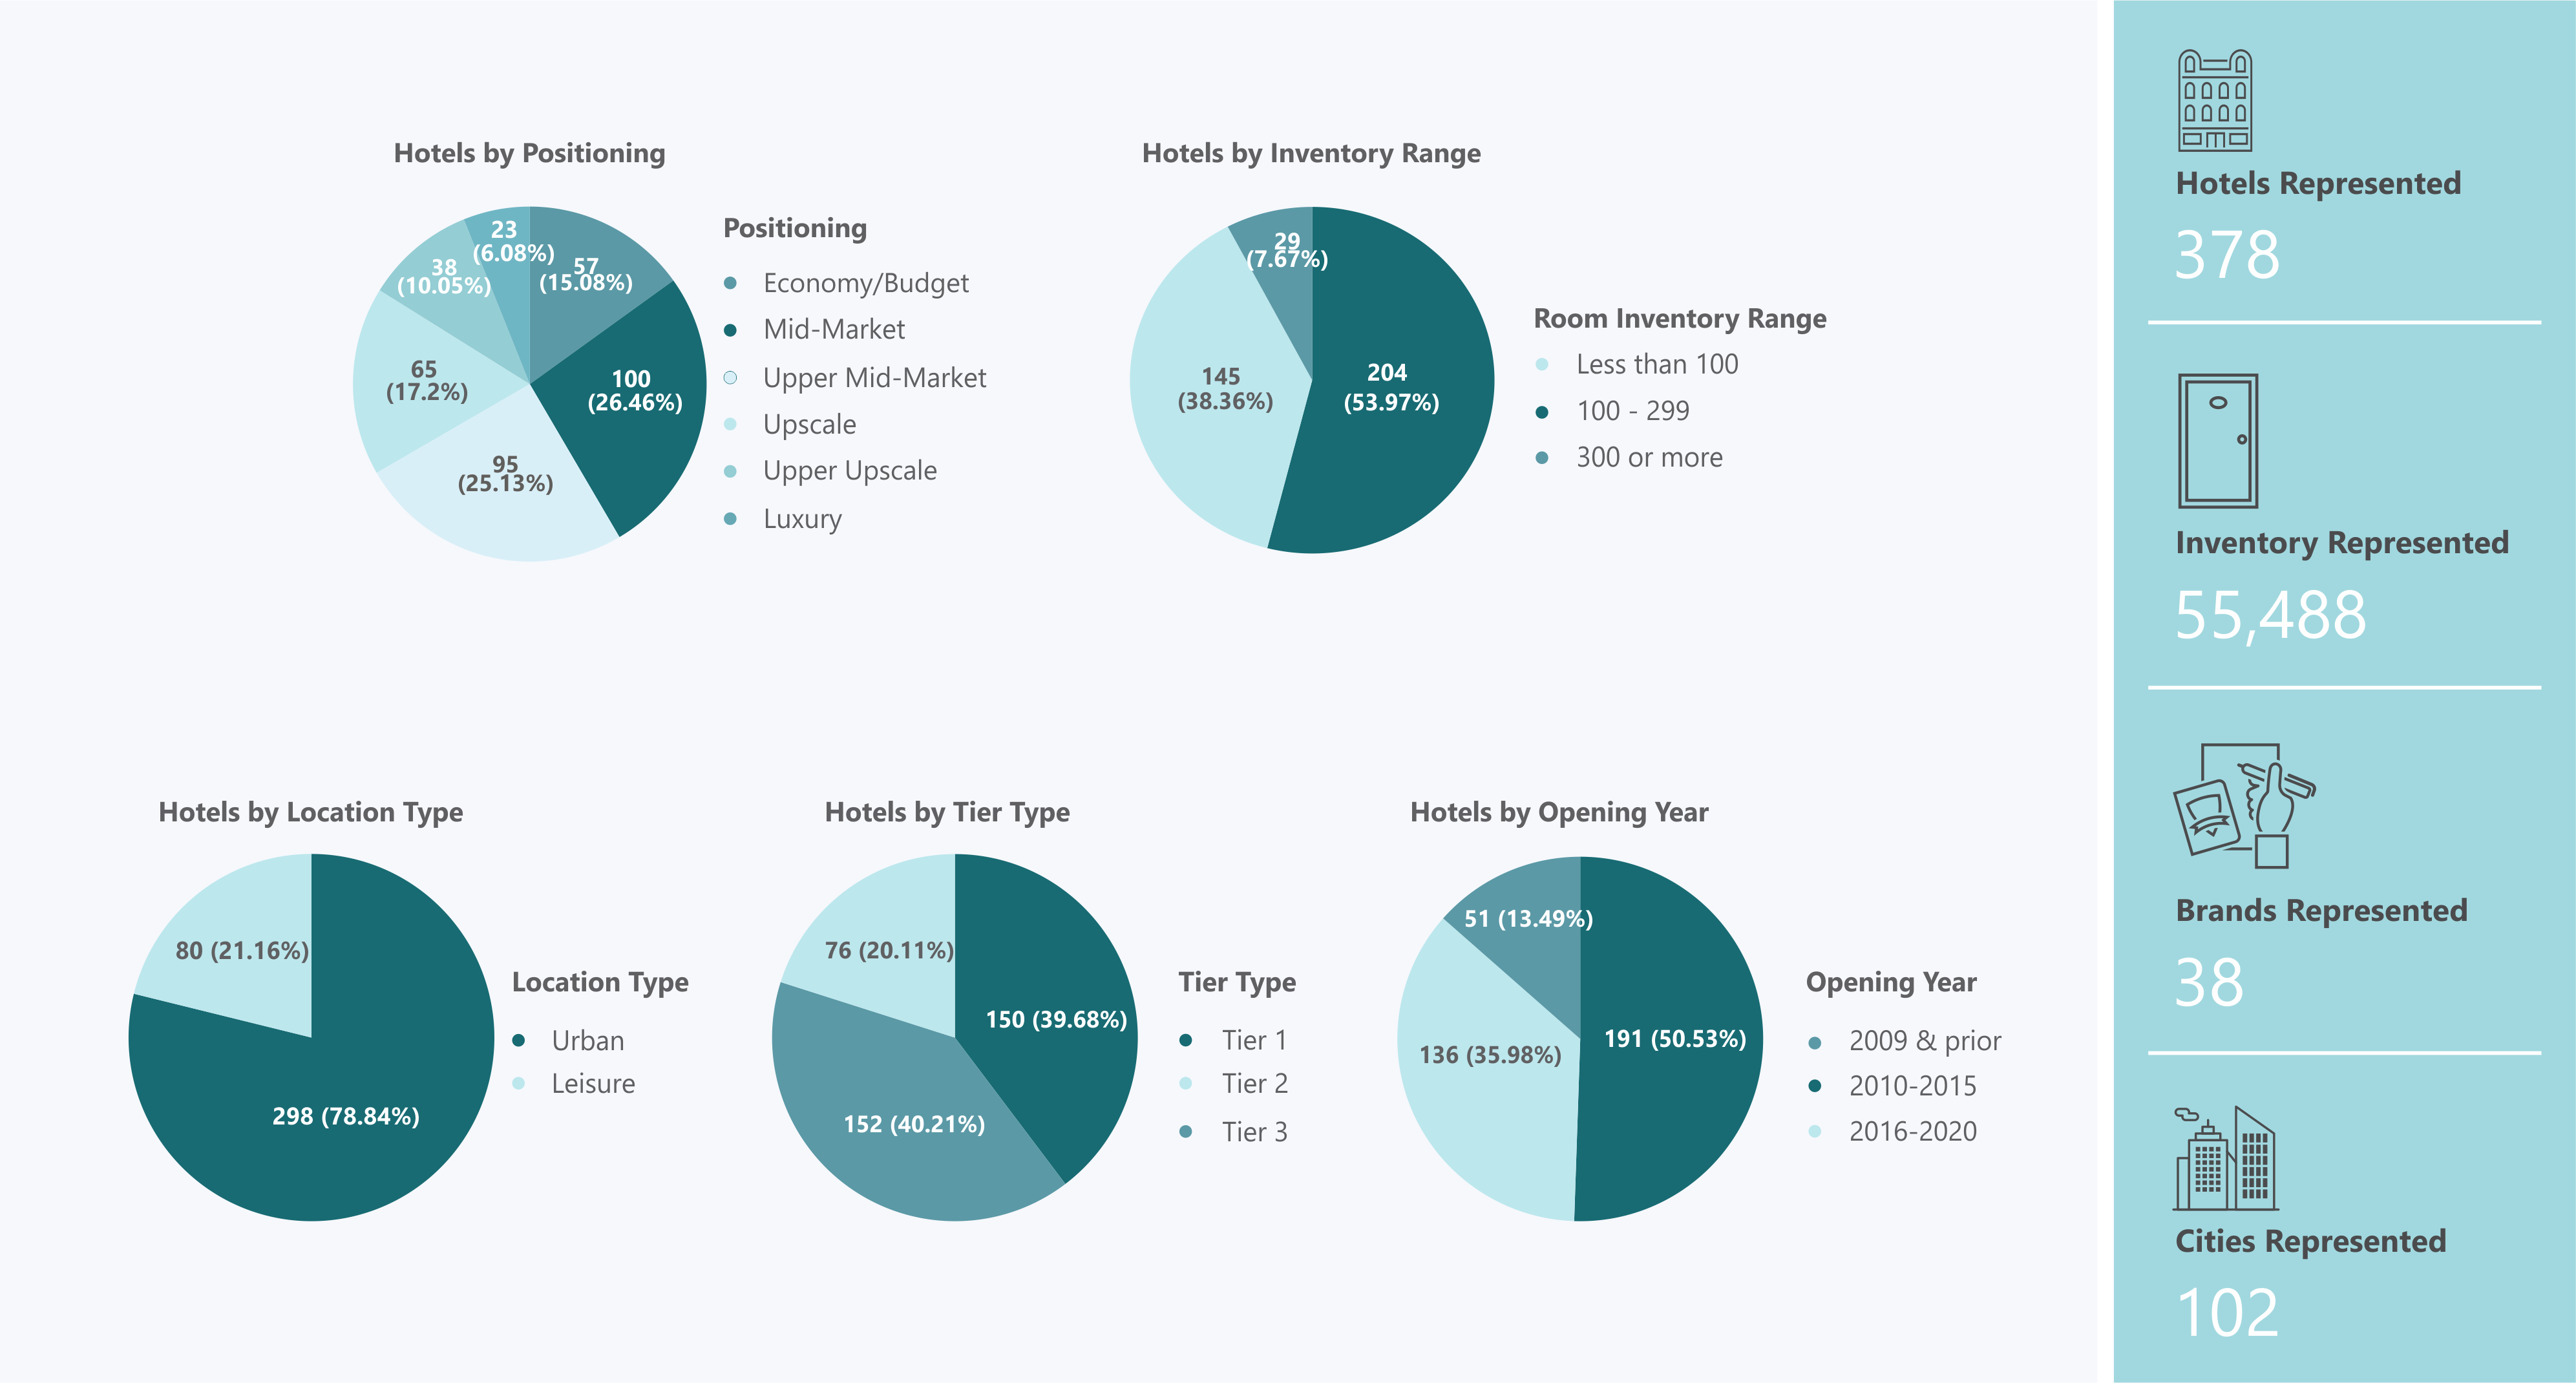
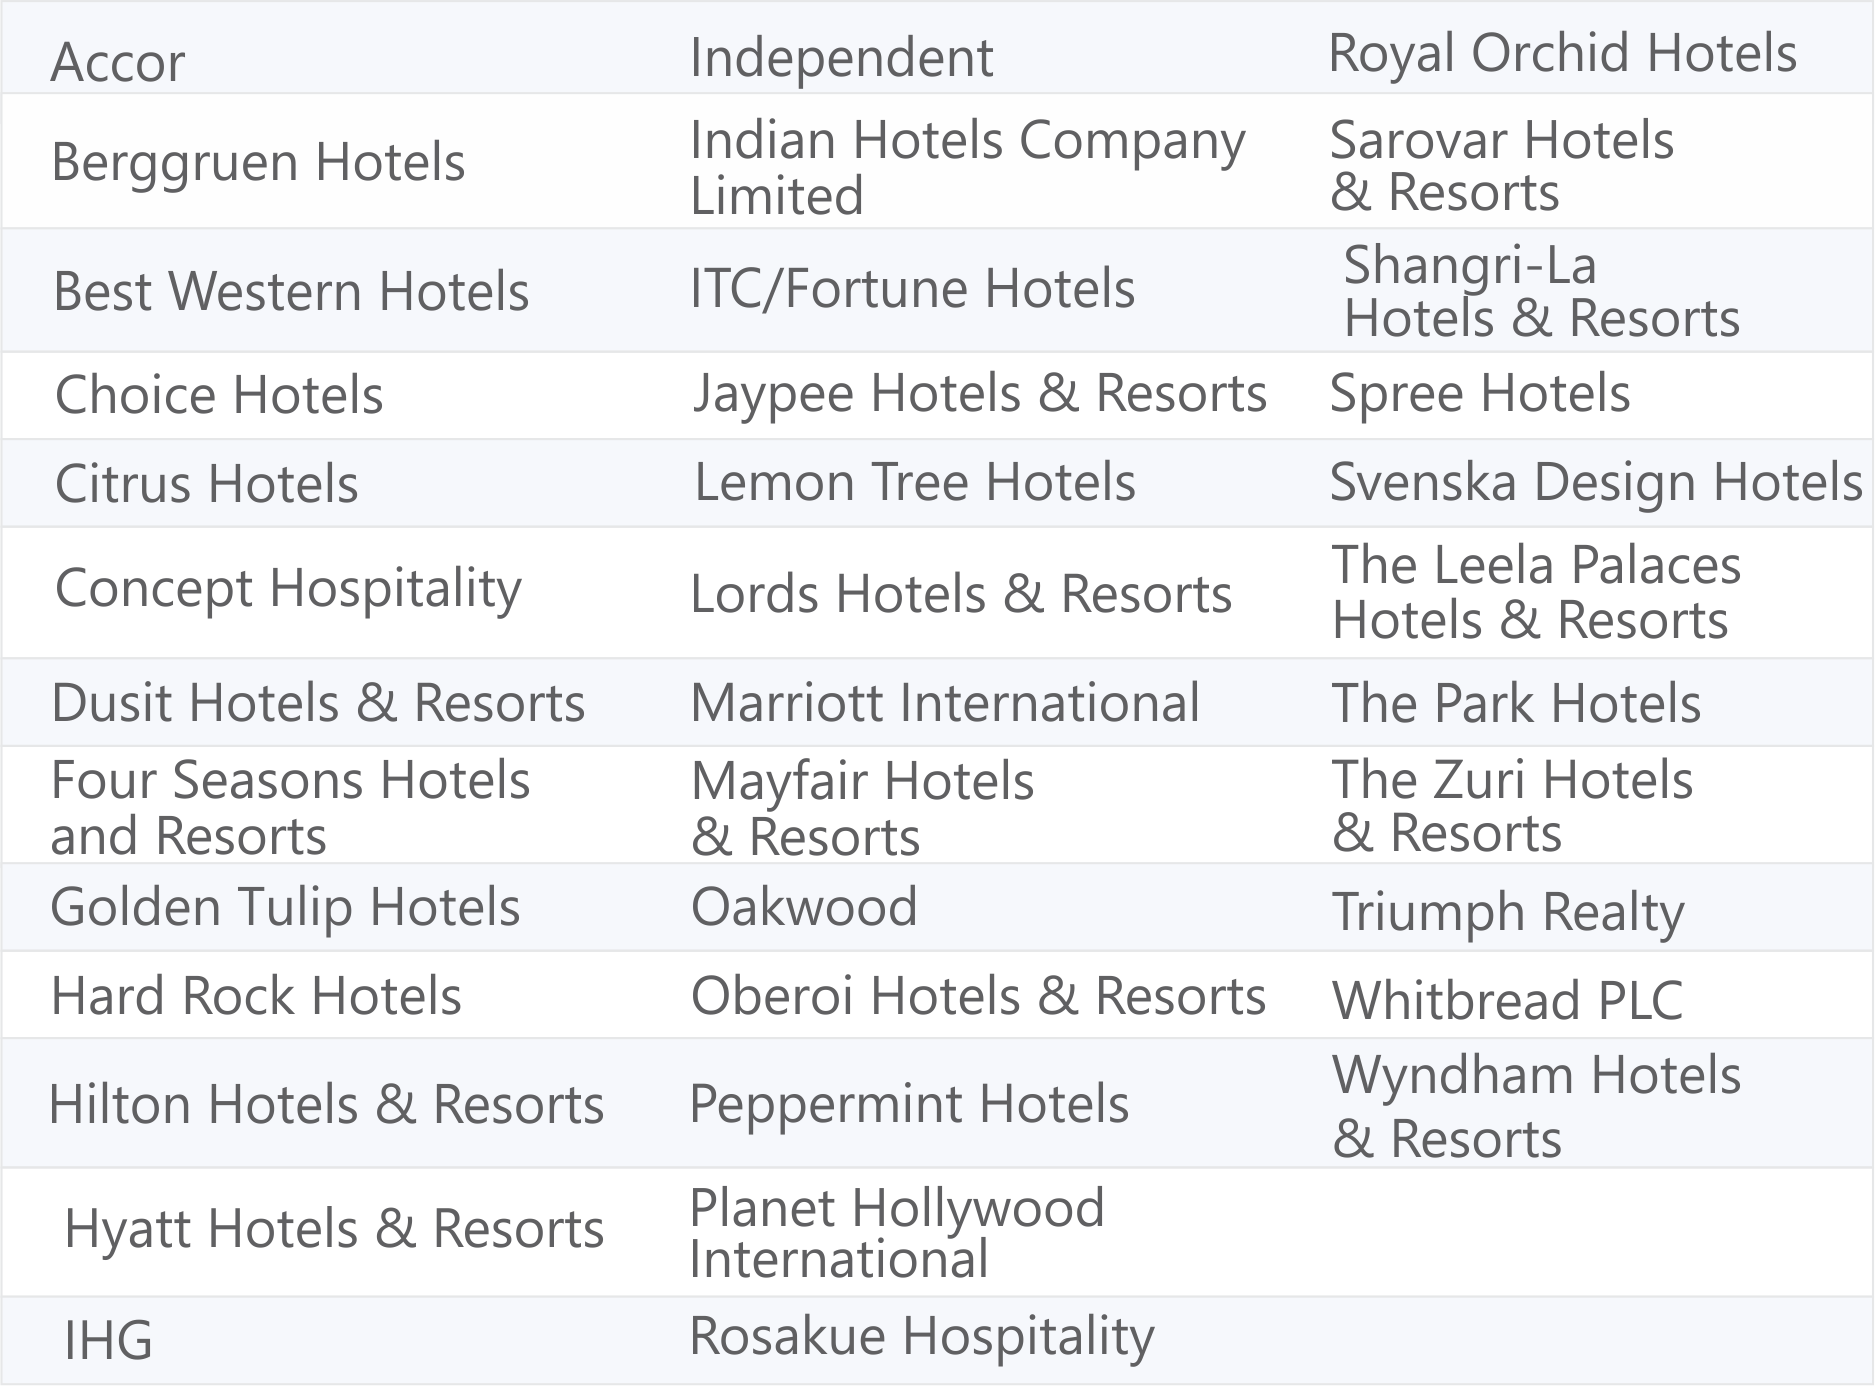
The survey sample set profile of 378 hotels, having 55,488 rooms across 102 Indian cities, has been illustrated below. Totally, this represents ~40% of the nation’s branded/organised hotel inventory spanning 38 hotel companies with numerous sub brands. In the report, where the sample set profile has influenced the survey results in ways contrary to the trends witnessed on ground, we have provided the necessary indications.
Figure 1: Sample Set of the Survey
Mid-Market and Upper Mid-Market hotels have the highest representation in the sample set, together accounting for 52% of the total; this supports the trend that the development of lower-positioned hotels has gained traction in the last decade. Additionally, most of the hotels are based in urban locations (primarily in Tier 1 and Tier 2 cities) and have 100–299 rooms, with the mean inventory of the sample set being 147 rooms. Also, 85% of the hotels opened in 2010 or later years, allowing for the identification and analysis of more recent trends.
QUALIFYING CONDITIONS
The development cost of each hotel and related information has been self-reported by the respondents. While careful attention has been paid to address anomalies and filter out incomplete or questionable data, we have not independently verified the accuracy of each data point.
The survey results do not consider effects of inflation, change in prices of essential commodities, and currency exchange rates, and instead reflect the development cost provided by the respondents as of the opening year of the hotel. Moreover, hotel development costs are impacted by a variety of factors that are unique to each project and hence, the survey results must not be viewed in isolation. They are only meant to serve as a guideline to aid comparison across positioning and other parameters used in this survey.
Not all hotels in the sample set have provided complete information on the breakdown of the development cost or other related information that has been analysed in this report. In such cases, we have carved out subsets of the sample to perform the analysis, eliminating responses with insufficient information.
All information has been collected and analysed by the staff of Hotelivate. Data confidentiality has been strictly maintained throughout this report, with survey results being presented only in the aggregate; no individual hotel, brand or operator has been identified. Hotelivate reserves the right to amend all or part of the report without prior notice. No information contained in this report may be reproduced or distributed in any form without the due acknowledgment and prior written consent of Hotelivate.
PRESENTATION OF SURVEY RESULTS
In this report, the survey results have been presented under the following four major sections:
Section A: Development Cost per Key
Section B: Development Cost per Key Breakdown by Major Cost Categories
Section C: Average Development Cost per Square Foot of Average Total BUA
Section D: Construction Tenure
Under each section, we have performed detailed analyses using five primary independent variables, as highlighted below.

For more information, please contact Megha Tuli at [email protected] or Shailee Sharma at [email protected]
