Indian Hotel Industry Survey 2016-2017
Compiled by Hotelivate in association with the Federation of Hotel & Restaurant Associations of India (FHRAI), the Indian Hotel Industry Survey 2016-17 is the twentieth edition of this publication since its inception.
T he Indian hotel industry has emerged as one of the key industries driving the growth of the services sector and, thereby, the Indian economy. The FHRAI Indian Hotel Survey 2016-2017 aims to provide the most comprehensive guide to All-India performance trends for this industry. Results of the Survey will empower industry stakeholders such as owners, investors, operators, business analysts and researchers with information on the operational aspects of the industry. It will also help owners benchmark the performance of their operations against industry standards and seek professional help if corrective measures are required.
Data Collection
The data for the FHRAI Indian Hotel Survey 2016-2017 has been contributed by the member hotels of FHRAI. The FHRAI sends out a questionnaire to each of its members (numbering approximately 2,662), the responses to which are then analysed and presented in this Survey. The data presented in the current edition is extracted from 966 responses of which 292 participants have provided the financial data for the respective operating assets.
Methodology
The data received from hotels participating in the Survey is sorted and filtered according to the objectives of the Survey. The data is then processed and analysed to extract important information pertaining to the performance of the Indian hospitality sector across crucial parameters. These parameters, such as guest segmentation, hotel finances, marketing, sources of reservations, and seasonality, among others, are then presented under the following categories:
- Star: Five-Star Deluxe, Five, Four, Three, Two, One-Star and Heritage hotels along with Other hotels (which are not classified under any star rating).
- Inventory: Number of rooms in hotels are categorised as Less than 50 Rooms, 50-150 Rooms, and More than 150 Rooms.
- Affiliation: Hotels are categorised into Affiliated to Chain and Independent hotels.
- Primary Markets: The seven major cities covered in this report are Bengaluru, Chennai, Delhi, Goa, Kolkata, Mumbai and Pune.
Indian Hotel Industry Performance – Country Trends
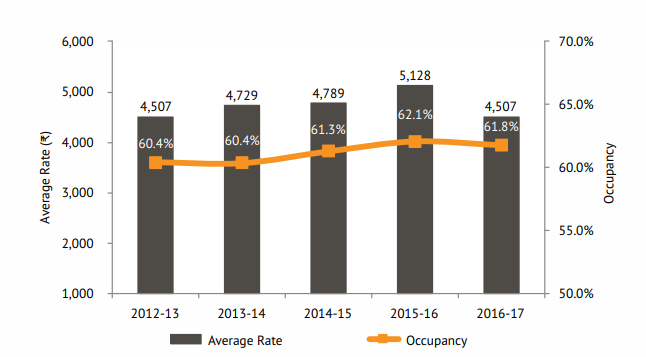
Occupancy and Average Rate: The average rate registered in 2016-17 was INR4,507, which witnessed a 12.1% drop over the previous year (INR5,128). Hotel occupancy, too, showed a modest decline of 0.5% over the previous fiscal (Exhibit 1). Hotelivate believes that the drop in the country’s average rate and occupancy is a result of the lower participation of hotels in the Five-Star Deluxe and Five-Star categories.
Exhibit 1: Occupancy and Average Rate (2012-13 to 2016-17)
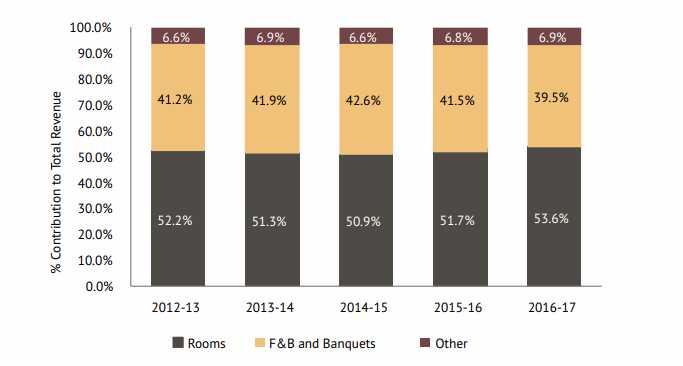
Contribution to Total Revenue: In 2016-17, Rooms Revenue contributed a notable 53.6% to the Total Revenue, an increase over its percentage share in 2015-16, and an improvement from the declining trend exhibited in the years 2012-13 to 2014-15. On the other hand, contribution from Food & Beverage and Banquets declined to 39.5% from 41.5% recorded in 2015-16. The contribution of the Other operating departments has remained range-bound, with a marginal increase recorded in 2016-17 over the previous fiscal.
Exhibit 2: Sources of Revenue (2012-13 to 2016-17)
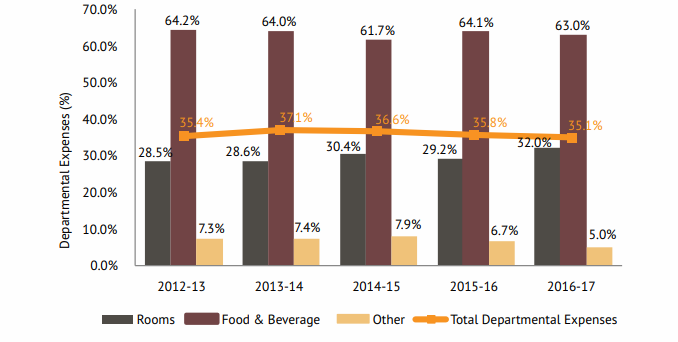
Decrease in Departmental Expenses: Since 2013-14, a decreasing trend of Departmental Expenses as a percentage of Total Revenue at an All-India level has been observed. This continued for 2016-17 as well, with the departmental expenses being recorded at 35.1%. This was mainly driven by the percentage decrease in Food & Beverage and Other Expenses. However, Rooms Expenses increased to an All-India average of 32.0%, a sharp increase from the previous year.
Exhibit 3: Departmental Expenses (2012-13 to 2016-17)
Cost Analysis: While Food and Beverage and Other Expenses, as a percentage of Total Revenue, remained relatively stable in 2016-17, the survey results depict a significant increase in the Rooms Expenses. On a per available room (PAR) basis, Administrative & General, Marketing Costs, Management Fees, Minor Operating Departments and Rental & Other Income decreased by 6%, 20%, 24%, 35% and 27%, respectively, over those recorded in 2015-16.
Guest Analysis: Domestic travellers continue to be the majority generators of room night demand in India. As per this year’s survey, the Domestic Business Traveller segment has displayed a year-on-year growth contributing 33.4% towards the total demand accommodated by the Indian hotel industry. Percentage of Domestic Tourists or Leisure Travellers has also witnessed a significant increase from 19.8% in 2015-16 to 22.2% in 2016-17. Foreign Demand, however, has seen a very marginal decline this fiscal contributing 19.4% between Business, Leisure and Tour Groups segments.
