India State Ranking Survey – 2017
Compiled by Hotelivate in association with the World Travel & Tourism Council – India Initiative (WTTC – II), the 2017 State Ranking Survey is the fifth edition of this publication since its inception in 2009.
India is one of the few countries in the world that thrives on its diversity. From geographic to cultural, linguistic to religious, overwhelming to some and deeply comforting to others, India is truly a feast for the senses. Sometimes, however, it is necessary to set aside those differences to gauge one’s position and potential. The State Ranking Survey aims at assessing the relative competitiveness of India’s 30 states, by analysing each individual state’s potential for Travel and Tourism.
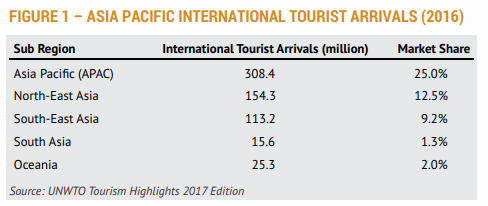
While India’s travel and tourism potential remains the focus of this report, let us first explore the magnitude of the region’s travel and tourism sector. The Tourism Highlights 2017 Edition report by the United Nations World Tourism Organisation (UNWTO) highlights that on a global scale, a total of 1.2 billion tourist arrivals were recorded in 2016. The majority of these tourist arrivals were bound towards Europe (approximately 50%) while Asia & the Pacific witnessed only 25% of these tourist arrivals (approximately 308.4 million). In 2016, India recorded approximately 8.8 million foreign tourist arrivals (exclusive of NRI arrivals and transit arrivals), accounting for 4.7% of Asia-Pacific’s tourist arrivals and 1.2% of the global tourist arrivals. These tourist arrivals include only overnight visitors and are not inclusive of transit arrivals, same day visitors or Non-Resident Indian (NRI) arrivals.

Not only is Travel, Tourism and Hospitality an integral part of the Indian economy, it is an integral part of our DNA as Indians. A quick performance review reveals that in 2016, an estimated US$22.9 billion was earned as Foreign Exchange Earnings; an 8.8% increase over the approximate US$21.1 billion earned in 2015. Additionally, India registered roughly 8.0 million international tourist arrivals in 2015 which grew by 9.7% to almost 8.8 million international tourist arrivals in 2016 (exclusive of NRI arrivals and transit arrivals).
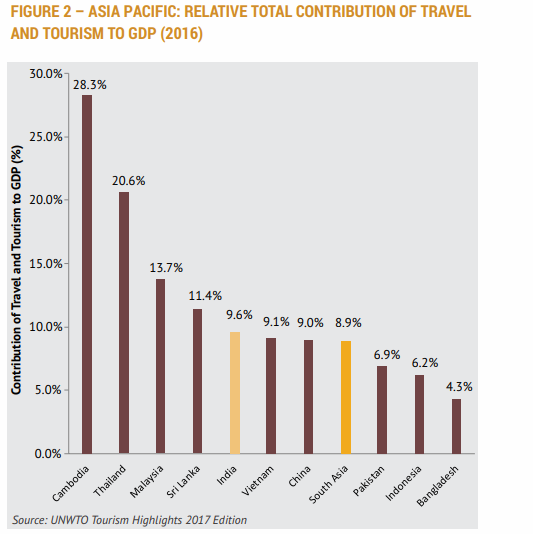
Reportedly, India’s total contribution of Travel and Tourism to GDP was 9.6% (US$208.9 billion or INR14,018.5 billion) in 2016, and is forecast to rise by 6.7% in 2017. On the employment generation front, having supported 40.3 million direct and indirect jobs in 2016, the travel and tourism industry accounts for almost 9.3% of the total employment in India. Despite the industry’s growth in India, the country still needs to overcome numerous challenges to establish itself as the foremost tourist destination in the region. Figure 2 highlights India’s position vis-à-vis other South Asian countries in terms of total contribution of Travel and Tourism to GDP.

The Travel and Tourism industry consists of multiple verticals which include hotels, airlines, and travel & tour companies. The State Ranking Survey aims to identify the best performing Indian states from the hospitality industry‘s viewpoint. In order to meet this objective, we employed 11 key parameters or criteria for evaluating the performance of different states. While some parameters apply specifically to hotel developers, others are more relevant for state governments.

